Measuring and analyzing key performance indicators (KPIs) is a crucial aspect of any successful marketing strategy. By tracking and analyzing these KPIs at each stage of the marketing funnel, businesses can gain a deeper understanding of their customers and optimize their marketing efforts to drive more sales. In this article, we will delve into the different KPIs to consider at each stage of the marketing funnel, including the awareness, consideration, and purchase stages. We will also explore the formulas and equations used to calculate these KPIs, so that you can effectively measure and analyze your marketing efforts.
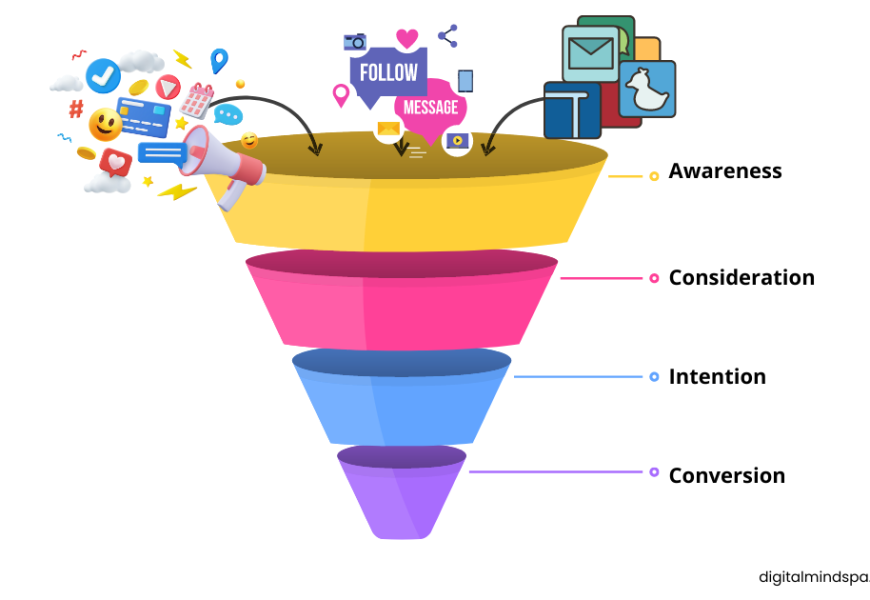
The marketing funnel helps businesses understand the customer journey from initial awareness to purchase. At the top of the funnel, businesses generate leads and attract visitors. They might track KPIs such as social media reach and organic traffic. At the middle funnel, businesses convert leads into qualified leads and track KPIs such as conversion rates and cost per lead. On the bottom of the funnel, businesses focus on driving sales and track KPIs such as sales qualified lead conversion rates and sales conversion rates.
Measuring Key Performance Indicators at the Top Funnel
At the awareness stage, also known as the top of the funnel, it’s important to measure the number of visitors and leads coming from various sources such as social media, search engine optimization (SEO), pay-per-click (PPC) advertising, and content marketing. This stage is all about attracting potential customers to your brand and getting them interested in your products or services.
Social Media KPIs:
One key way to measure the effectiveness of your social media marketing efforts is to track your social media reach in terms of the number of accounts reached, video views, and increase in followers and likes. You might also track your social media organic traffic, which refers to the number of people who visit your website from your social media profiles. This can be calculated using the following formula:
Organic Social Traffic = No. of Visits from Social Media Organic Post / Total Number of Visits
You might also track your social media paid traffic, which refers to the number of people who visit your website as a result of paid social media ads. This can be calculated using the following formula:
Paid Traffic = No. of Visits from Paid Social Media Ads / Total Number of Visits
Search Engine Optimization (SEO) KPIs
Another important aspect of the awareness stage is SEO, which involves optimizing your website and content to rank highly in search engine results pages (SERPs). To measure the effectiveness of your SEO efforts, you might track your organic traffic, which refers to the number of people who visit your website from search engine results pages. This can be calculated using the following formula:
Organic Traffic = No. of Visits from Search Engine Results Pages / Total Number of Visits
You might also track impressions, which refer to the number of times your website appears in search results. This can be calculated using the following formula:
Impressions = No. of Times Website Appears in Search Results / Total Number of Search Results
You might also track your search engine rankings for specific keywords. This can be calculated by tracking your position in the search results for a particular keyword and dividing it by the total number of search results for that keyword. For example, if your website is ranked fifth out of a total of 10 search results for a particular keyword, your ranking would be calculated as follows: Ranking = Position in Search Results / Total Number of Search Results
= 5 / 10
= 0.5
PPC Advertising KPIs
PPC advertising involves placing paid ads on search engine results pages or other websites, with the goal of driving traffic to your website. To measure the effectiveness of your PPC advertising efforts, you might track your paid traffic, which refers to the number of people who visit your website as a result of your paid ads. This can be calculated using the following formula:
Paid Traffic = Number of Visits from Paid Ads / Total Number of Visits
CPC, or cost-per-click, is a key performance indicator (KPI) that measures the cost of each click on an advertisement. It is typically used to track the effectiveness of paid advertising campaigns, such as Google AdWords or Facebook Ads . To calculate CPC, divide the total cost of the ad campaign by the number of clicks received following the formula:
CPC = Total Ad Spend / Total Clicks
CPC = $2000/5000
CPC = $1.47
A lower CPC is generally considered more desirable, as it indicates that the ad is more effective at driving traffic at a lower cost.
You might also track your conversion rates, which refer to the percentage of visitors who take a desired action, such as making a purchase or filling out a form. This can be calculated using the following formula:
Conversion Rate = (Number of Desired Actions / Total Number of Visitors) *100
Content Marketing KPIs
Content marketing involves creating useful contents to attract and maintain a clearly defined audience. By creating valuable content that resonates with your target audience, you can build trust, establish yourself as an authority in your industry, and ultimately drive more leads and sales. To measure the effectiveness of your content marketing efforts, you might track your content’s reach, which refers to the number of people who see your content. This can be calculated using the following formula:
Reach = Number of People Who See Your Content / Total Number of People in Your Target Audience
You might also track your content’s engagement, which refers to the number of people who interact with your content, such as by liking, commenting, or sharing it. This can be calculated using the following formula:
Engagement = Number of Interactions with Your Content / Total Number of People Who See Your Content
You might also track your content’s conversion rates, which refer to the percentage of people who take a desired action after reading or viewing your content.
Cost per Mille (CPM)
CPM, or cost per mile, is a metric used to determine the cost of displaying an advertisement to 1,000 viewers. To find the CPM, divide your total ad spend by the number of impressions generated and then multiply the result by 1,000. CPM can help you figure out how much it costs to reach a certain number of people with your advertising and can be useful for comparing different campaigns.
In the top part of the marketing funnel, the goal is usually to get people to become aware of a product or service and attract lots of potential customers. In this stage, the focus is on reaching as many people as possible and building a large group of potential customers. CPM can be one of your best key performance indicators in this initial journey. By keeping track of CPM, advertisers can see how much it costs to reach a certain number of people and compare the effectiveness of different advertising campaigns. To calculate CPM, use the formula below:
CPM = (Total Ad spend / Total of impressions) x 1,000
CPM = ($1000 / 150,000) x 1,000 = $6.7
This means that it cost $6.7 to deliver the advertisement to 1,000 people.
Tracking traffic can be easily done using the Google Analytics tool. By integrating tracking pixels and tags on social media and paid search campaigns, it is possible to view all traffic data in one dashboard or view within Google Analytics. This makes it convenient to track and analyze traffic from multiple sources in one place.
Analyzing Key Performance Indicators at the Middle Funnel
In the consideration stage, also known as the middle of the funnel, it’s important to focus on conversion rate optimization, which involves measuring the number of qualified leads (MQLs) and conversion rates. This stage is all about getting potential customers to take the next step towards becoming paying customers.
Marketing Qualified Lead (MQL) to Sales Qualified Lead (SQL) Conversion Rates
One key KPI to track at the consideration stage is the number of MQLs that converts into SQLs. MQLs are prospect leads that have demonstrated an interest in a company’s offerings and are likely moving closer to making a purchase, but are not yet at the point of committing to a sale. On the other hand, SQLs are regarded as “hot leads” and are already in the buying phase, ready to act. By tracking the percentage of MQLs that convert into SQLs, businesses can gain insight into the effectiveness of their marketing efforts at this stage. The conversion rate can be calculated using the following formula:
MQL to SQL Conversion Rate = (Number of SQLs / Number of MQLs ) *100
Cost per Lead (CPL) as Key Performance Indicator
Another important KPI to track at the consideration stage is the cost per lead (CPL). This refers to the amount of money you spend to acquire each lead, and it can help you understand the efficiency of your lead generation efforts. By tracking your CPL over time, you can identify trends and make adjustments to your marketing strategy to drive more leads at a lower cost. This can be calculated using the following formula:
CPL = Total Cost of Lead Generation / Number of Leads
CPL = $30,000 Ad Spend / 500 Leads
CPL = $60
Note: The cost per lead (CPL) may vary depending on the industry. For example, in the real estate industry, a CPL of $60 might be considered reasonable. However, it is possible to lower the CPL by introducing a retargeting campaign, which we will discuss in more detail below.
Visitors to Lead Conversion Rates
In addition to tracking MQL and CPL metrics, it’s also important to track the percentage of visitors who convert into leads at the consideration stage. This can help you understand how well your website and marketing efforts are driving conversions and identify areas for improvement. This can be calculated using the following formula:
Visitors to Lead Conversion Rate = (Number of Leads / Number of Visitors) * 100
VLCR = 200 Leads / 20,000 Visits
VLCR = 1%
Tracking Key Performance Indicators at the Bottom Funnel
On the purchase stage, also known as the bottom of the funnel, you’ll want to focus on driving sales through channels such as email and SMS marketing and Remarketing. This stage is all about turning leads into paying customers.
Sales Qualified Lead (SQL) Conversion Rates
One important key performance indicators to track at the purchase stage is the percentage of SQLs that convert into paying customers. This can help you understand the effectiveness of your marketing efforts at this stage and identify areas for improvement. This can be calculated using the following formula:
SQL Conversion Rate = (Number of Customers / Number of SQLs) * 100
SQL CR = 100 Paying Customers / 1000 SQLs
SQL CR = 10%
Sales Conversion Rates (SCR)
Overall, it’s important to track the percentage of visitors who make a purchase, also known as the sales conversion rate. This can help you understand the effectiveness of your marketing efforts overall and identify areas for improvement. This can be calculated using the following formula:
Sales Conversion Rate (SCR) = (Number of Sales / Number of Visitors) * 100
SCR = 10 Sales / 500 Visits
SCR = 2 %
Return on Ad Spend (ROAS)
ROAS, or return on ad spend, is a key performance indicator (KPI) that measures the effectiveness of a company’s advertising campaign. It is calculated by dividing the total revenue generated from a campaign by the total cost of the campaign. For example, if a company spends $30, 000 on an advertising campaign and generates $174,000 in revenue from the campaign, their ROAS would be $2.5 ($74,000/$30,000). Meaning, for every $1 spent on ads, the campaign generates $2.5 revenue.
ROAS is an important KPI to consider at the bottom of the marketing funnel because it helps businesses understand the effectiveness of their marketing efforts in driving sales. By tracking their ROAS and optimizing their advertising campaigns, businesses can improve their marketing Return of Investment (ROI) and drive more sales.
Leveraging Remarketing to Enhance the User Journey
Remarketing is a marketing strategy that involves showing targeted ads to people who have previously visited a website. It can be used at various stages of the marketing funnel to achieve different goals. At the bottom of the funnel, Remarketing is often most effective when used to drive sales. This might involve targeting ads to people who have already viewed or signed up for lead forms, completed a certain percentage of video ads, or are close to making a purchase, such as by targeting ads for related products or upsells to existing customers or targeting ads to people who have abandoned their shopping carts. To measure the effectiveness of your Remarketing efforts, you might track metrics such as ad engagement, website traffic, and conversion rates.
In the middle funnel, Remarketing can be used to re-engage interested leads and encourage them to take further action towards making a purchase.This might involve targeting ads to people who have viewed specific products on your website or visited your website multiple times but have not yet converted.
Remarketing campaigns can also be run alongside top funnel campaigns to target ads to specific segments of the audience who have already engaged with the brand in some way. By carefully considering the goals and objectives of the campaign and analyzing the relevant key performance indicators, businesses can effectively use Remarketing to drive more sales and optimize their marketing efforts at any stage of the funnel.
Calculating customer lifetime value (CLV) can help businesses determine the profitability of their marketing campaigns. CLV is the estimated amount a customer will spend on a company’s products or services over the course of their lifetime. When running performance Remarketing campaigns, it can be helpful to consider CLV as KPI when determining ad bids. Customers with a higher CLV are generally more valuable to a business and may be more likely to generate more revenue in the long run.
In conclusion, measuring and analyzing key performance indicators (KPIs) is a crucial aspect of any successful marketing strategy. By tracking and analyzing these KPIs at each stage of the marketing funnel, businesses can gain a deeper understanding of their customers and optimize their marketing efforts to drive more sales. The marketing funnel is a useful framework for understanding the customer journey from initial awareness to final purchase, and tracking KPIs at each stage of the funnel can help businesses optimize their marketing efforts and improve their overall marketing ROI. By understanding the different KPIs to consider at each stage of the marketing funnel, businesses can effectively measure and analyze their marketing efforts and make data-driven decisions to drive more sales.